Activity Monitor on Mac: The Complete Guide
Activity Monitor is the Mac’s built-in task manager, and most people only ever use a tenth of it. This guide shows how to open Activity Monitor on Mac, what every tab actually tells you, which processes you should never quit, and the hidden features, all checked on macOS 27.

To open Activity Monitor on a Mac, press ⌘ Command + Space, type Activity Monitor and press Return. It also lives in Finder under Applications > Utilities. Activity Monitor is the Mac’s task manager: its five tabs (CPU, Memory, Energy, Disk, Network) show what every process is using, and the stop button at the top quits the one you select.
How do I find Activity Monitor on my Mac?
Activity Monitor is installed on every Mac in the Utilities folder, and has been since Mac OS X 10.3 (Wikipedia). It is the Mac counterpart of the Task Manager Windows opens with Ctrl+Shift+Esc (Microsoft). There is no default keyboard shortcut for it, but these routes all work on macOS 13 Ventura through macOS 27, which is what we tested on:
- Spotlight: press Command + Space, type Activity, press Return. The fastest way.
- Finder: press Shift + Command + U to open Utilities, then double-click Activity Monitor.
- Dock: once it is open, Control-click its Dock icon and choose Options > Keep in Dock.
- Siri: say “Open Activity Monitor”.
- Terminal: type
open -a "Activity Monitor"and press Return.
Want a real shortcut? Open the Shortcuts app, create a shortcut with the single action Open App > Activity Monitor, then in the shortcut’s details click Add Keyboard Shortcut and press the keys you want, for example ⌃ Control + ⌥ Option + A.
What do the Activity Monitor tabs show?
Each tab answers one question:
| Tab | Question it answers | Column to sort by | Worry when |
|---|---|---|---|
| CPU | What is making my Mac hot, loud or slow? | % CPU | One app stays above 100% for minutes |
| Memory | Am I running out of RAM? | Memory | Memory Pressure is yellow or red |
| Energy | What is draining my battery or keeping the Mac awake? | Energy Impact / 12 hr Power | “Preventing Sleep” says Yes for an app you are not using |
| Disk | What is reading or writing the SSD? | Bytes Written | Heavy writes while you are idle |
| Network | What is using the internet connection? | Sent Bytes / Rcvd Bytes | An app you do not recognise is sending a lot |
A sixth tab, Cache, appears only when Content Caching is switched on in Sharing settings. GPU use has its own window: Window > GPU History, or ⌘ Command + 4.
CPU tab: what is slowing my Mac down?
The CPU tab shows which processes are using the processor right now. Sort by % CPU and the app slowing your Mac is almost always in the top three rows.
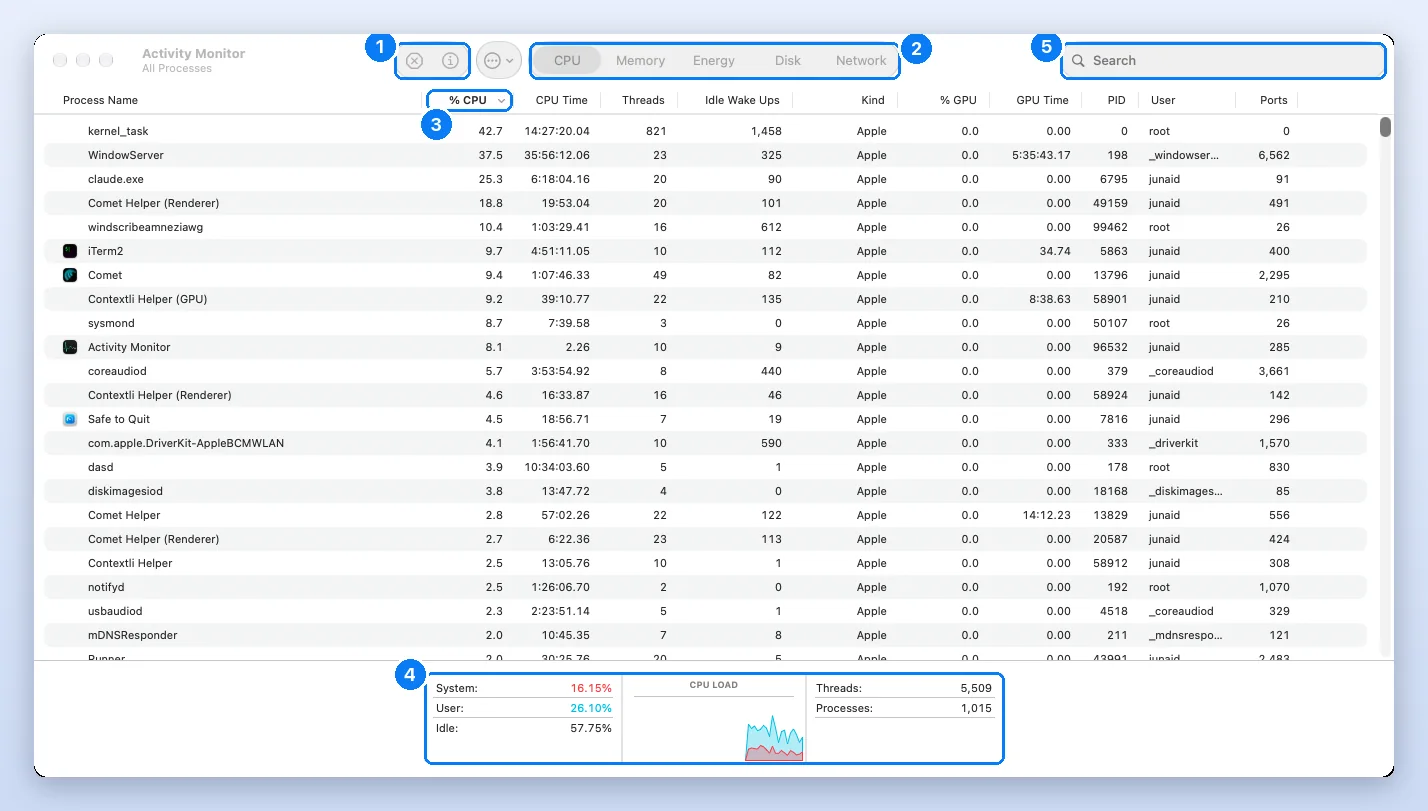
Click % CPU so the busiest process is on top. The numbers are per core: on our 8-core M1 Pro, the maximum is 800%. The panel at the bottom splits total load into three parts, as Apple’s CPU guide defines them:
System: The percentage of CPU capability that’s being used by processes that belong to macOS. User: The percentage of CPU capability that’s being used by apps you opened, or by the processes opened by those apps.
At the moment we captured the screenshot, 1,015 processes and 5,509 threads were running and the Mac was still 57.75% idle. That is normal. What is not normal is one app you opened sitting near the top for minutes on end. Deeper guide: How to check CPU usage on Mac.
Memory tab: do I need more RAM?
The Memory tab tells you whether you need more RAM: if the Memory Pressure graph stays green through a normal day, you do not.
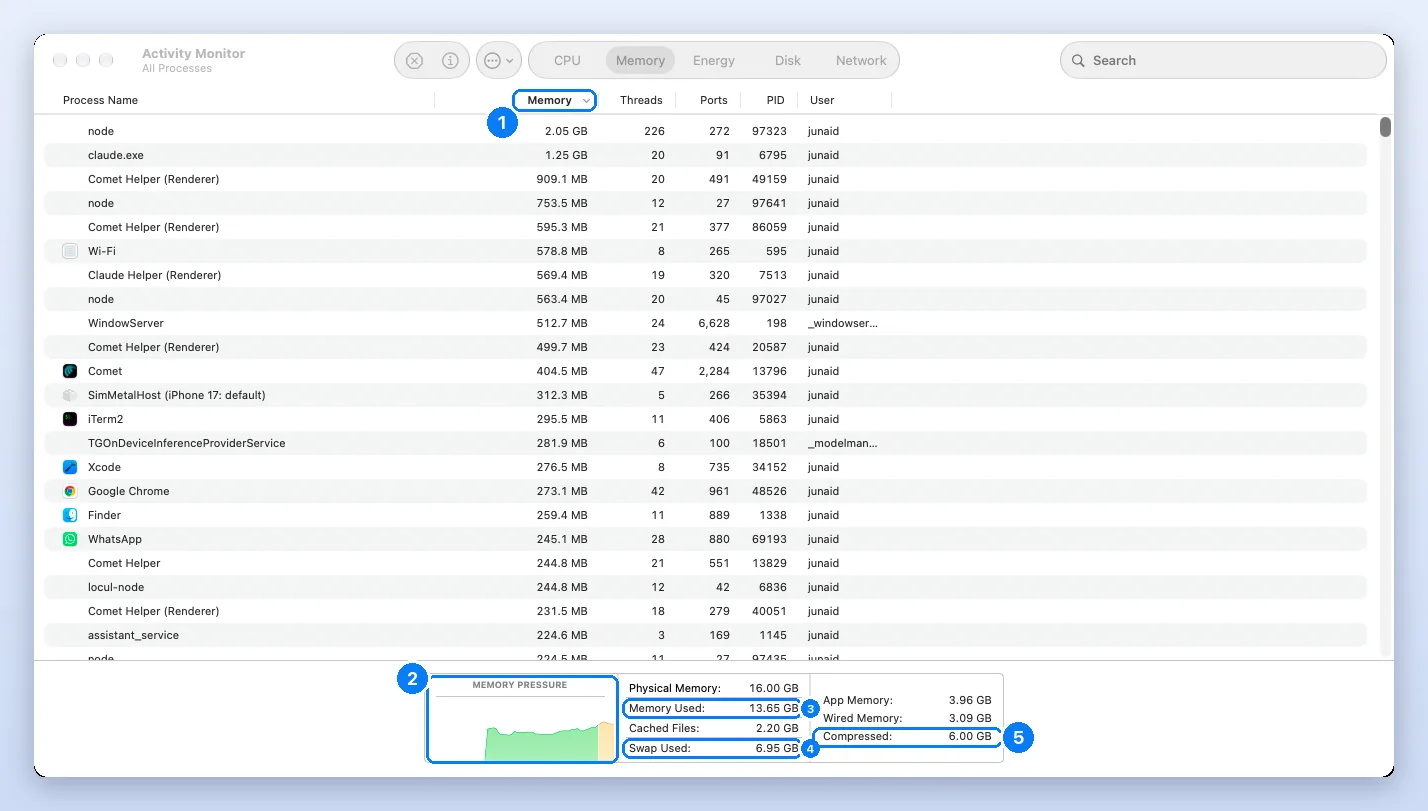
Ignore Memory Used on its own. macOS fills free RAM with cached files on purpose, so a Mac that has been on for a day almost always looks nearly full. The number that matters is the Memory Pressure graph: green means fine, yellow means the Mac is working to keep up, red means it needs more memory than it has. Our test Mac showed 13.65 GB used of 16 GB, which sounds alarming, with green pressure, which means it was coping. Full walkthrough: How to check RAM usage on Mac.
Energy tab: what is draining the battery?
Sort by Energy Impact for right now, or 12 hr Power (laptops only) for the average since this morning. Two more columns are worth knowing:
- App Nap: Yes means macOS is throttling that app because it is in the background. Good.
- Preventing Sleep: Yes means the app is keeping your Mac awake. A video call should; a text editor should not.
Energy Impact: A relative measure of the current energy consumption of the app (lower is better).
Disk tab: what is using my SSD?
The Disk tab shows how much each process has read from and written to the drive since it started, plus reads and writes per second in the bottom panel. Sort by Bytes Written. A spike after a macOS update is usually Spotlight re-indexing (mds_stores) and settles within hours. A constantly high writer while you are idle, such as a sync client re-uploading the same folder, is worth investigating because heavy writes also slow the Mac down.
Network tab: what is using my internet?
The Network tab lists bytes and packets sent and received per process, with a live graph at the bottom. Sort by Sent Bytes if you suspect an app is uploading in the background, or Rcvd Bytes when downloads feel slow. Cloud sync apps, backup tools, browsers and video calls normally top this list; an unfamiliar name sending data steadily deserves a closer look (see the monitoring checklist below).
Which columns should I add?
Choose View > Columns to add or remove columns in any tab. Three are worth switching on:
- Kind (CPU tab): Apple means the process runs natively on Apple silicon; Intel means it runs through Rosetta translation and uses more power. On our test Mac every top process showed Apple.
- PID: the process ID you need for Terminal commands like
kill. - Compressed Memory (Memory tab): how much of each app’s memory macOS has squeezed to save room.
How to quit a process in Activity Monitor
- Select the process in the list. Unresponsive ones are shown in red with (Not Responding).
- Click the stop button (X in a circle) at the top left, or press ⌥ Option + ⌘ Command + Q.
- Choose Quit. If nothing happens, repeat and choose Force Quit.
Quit: This is the same as choosing File > Quit within an app. The process quits when it’s safe to do so. If quitting the process could cause data loss or interfere with another app, the process doesn’t quit.
How do you know what to close in Activity Monitor?
These are the processes people most often ask about, what each one does, and whether to quit it:
| Process | What it is | Safe to quit? |
|---|---|---|
kernel_task | The core of macOS. Also used to slow the CPU when the Mac is hot | Never |
WindowServer | Draws every window. Higher with more displays and animations | Never: logs you out |
mds_stores, mdworker | Spotlight indexing | No, it finishes on its own |
photolibraryd, photoanalysisd | Photos library and on-device analysis | Leave it; it pauses when you use the Mac |
backupd | Time Machine | Stop the backup from the menu bar instead |
... Helper (Renderer) | One browser or Electron app tab or window | Yes, closes that tab |
com.apple.WebKit.WebContent | A Safari tab or web view | Yes, that tab reloads |
| Any app you opened | Itself | Yes, use Quit before Force Quit |
A real example from writing this page: photolibraryd hit 43.6% CPU on our test Mac while the Photos app was not even open. Twenty minutes later every Photos process was back at 0.0%, and we had not touched anything. Background work like this looks alarming in a single snapshot and sorts itself out.
Hidden features worth knowing
- Live Dock icon: View > Dock Icon > Show CPU Usage (or CPU History, Network Usage, Disk Activity) turns the Dock icon into a graph.
- Floating graphs: Window > CPU Usage (⌘ Command + 2) and CPU History (⌘ Command + 3). Tick Window > Keep CPU Windows on Top.
- Filters: the View menu can show only My Processes, Windowed Processes, GPU Processes or Applications in Last 12 Hours.
- Update speed: View > Update Frequency offers 1, 2 or 5 seconds.
- Always-on menu bar graph: Activity Monitor has none, but the free, open-source Stats app adds CPU, memory and network graphs to the menu bar.
- Inspect: select a process and press ⌘ Command + I to see its parent process, memory, open files and ports.
- Diagnostics: the ••• toolbar button creates a Sample (3 seconds of what a process is doing), a Spindump for hung apps, or a full System Diagnostics report for Apple Support, as described in Apple’s diagnostics guide.
How can I tell if my Mac is being monitored?
Activity Monitor helps, but it is only one of four checks:
- Network tab: sort by Sent Bytes and look for names you do not recognise sending data steadily.
- Privacy & Security: in System Settings, check Screen & System Audio Recording, Accessibility, Input Monitoring, Camera and Microphone for apps you did not approve.
- Device Management: System Settings > General > Device Management shows any installed profile. On a personal Mac there should be none.
- The menu bar dot: an orange dot means the microphone is on, green means the camera is on.
Activity Monitor in Terminal
The top command gives a live, Activity Monitor style list in Terminal, useful over SSH. This one sorts by CPU and shows the top 6:
top -l 1 -o cpu -n 6 -stats pid,command,cpu,mem
PID COMMAND %CPU MEM
198 WindowServer 27.2 522M
0 kernel_task 14.0 152M
7816 SafeToQuit 9.7 343MWatch it done
Frequently asked questions
How do I find my Mac Activity Monitor?
Press Command + Space, type Activity Monitor and press Return, or open Finder, choose Go, Utilities, and double-click Activity Monitor.
What is the shortcut for Activity Monitor on Mac?
There is no built-in one. Use Command + Space and type Activity, or make your own shortcut in the Shortcuts app with the Open App action and Add Keyboard Shortcut.
How do I check why my Mac is running slow?
Open Activity Monitor. On the CPU tab, sort by % CPU to find a busy app. On the Memory tab, check the Memory Pressure graph: yellow or red means you are short of RAM.
How do you know what apps to close in Activity Monitor?
Close apps you opened yourself that sit at the top of % CPU or Memory for a long time. Never quit kernel_task, WindowServer or other system processes.
How can I tell if my Mac is being monitored?
Check the Network tab for unknown apps sending data, review Privacy and Security permissions and Device Management in System Settings, and watch the orange or green dot in the menu bar.
Why is there an Activity Monitor on my Mac?
It is a built-in macOS app, the Mac equivalent of Windows Task Manager. Apple includes it on every Mac so you can see and quit running processes.
Is Activity Monitor the same as Task Manager?
Very close. It covers Task Manager's Processes, Performance and App history views. For the quick end-task window, use Command + Option + Esc.
Junaid is a software engineer who builds native macOS apps, which means he spends his days inside Activity Monitor, Instruments and the Terminal watching how Mac apps use CPU and memory. Before that he worked as an L2 technical support consultant, resolving around 500 escalated customer tickets with a satisfaction score above 95%. He holds a BSc in Software Engineering from NUST. Every step on this site is re-run on a real Mac before it is published.
Sources
- Apple: Activity Monitor User Guide
- Apple: View CPU activity in Activity Monitor
- Apple: View memory usage in Activity Monitor
- Apple: View energy consumption in Activity Monitor
- Apple: Quit an app or process in Activity Monitor
- Apple: Run system diagnostics in Activity Monitor
- SS64: top command for macOS
- Apple Support: Mac keyboard shortcuts
- Wikipedia: List of built-in macOS apps
- Microsoft Support: Keyboard shortcuts in Windows
- GitHub: Stats, an open-source macOS menu bar monitor