How to Check CPU Usage on Mac
To check CPU usage on a Mac, you sort Activity Monitor by % CPU. The harder part is knowing what the numbers mean, since one app can show 300% and still be fine. This guide covers CPU usage on Mac step by step, what normal looks like, the Terminal commands, and what to do when it runs high.

To check CPU usage on a Mac, open Activity Monitor (⌘ Command + Space, type Activity Monitor, Return), click the CPU tab and click the % CPU column so the busiest process is on top. Total load is at the bottom as System, User and Idle. Each process’s % CPU is per core, so on an 8-core Mac the maximum is 800%.
How to check CPU usage on Mac with Activity Monitor
- Open Activity Monitor. Press Command + Space, type Activity Monitor, press Return.
- Click the CPU tab. It is the first of the five tabs at the top.
- Click the % CPU column header so the process using the most CPU is at the top. Click again to reverse.
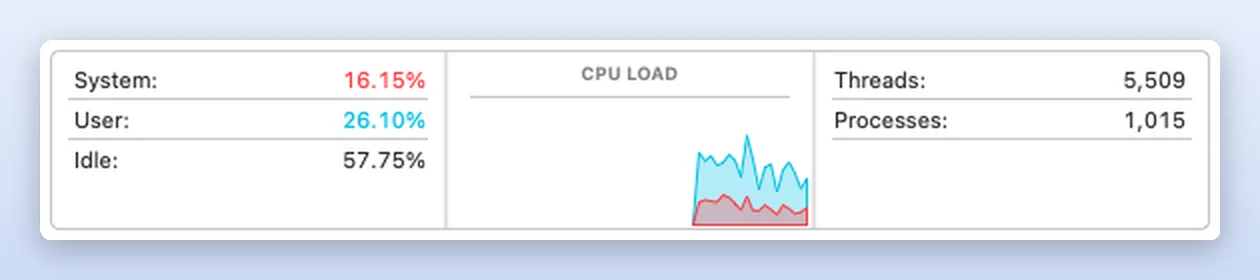
- Read the bottom panel. System is macOS, User is your apps, Idle is what is left.
- Watch for a minute. A process that spikes and drops is normal; one that stays high is the one to look at.
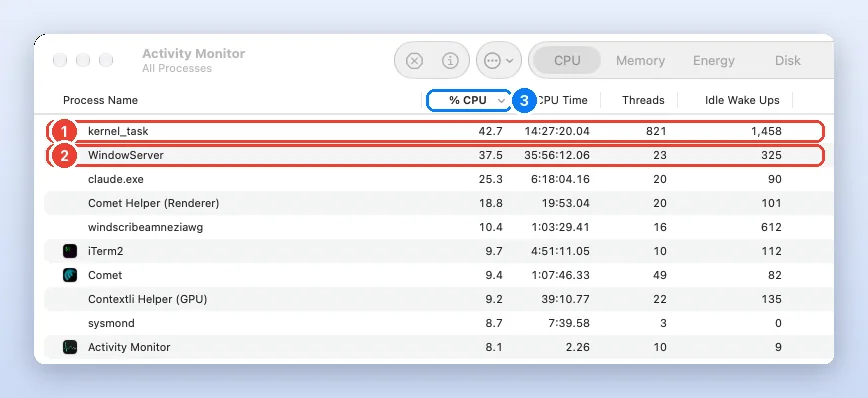
Most of the time, the processor on your Mac uses only a small percentage of its processing power. When you use apps that require intensive calculation, the processor uses more of its capacity.
Why can % CPU be over 100%?
Because Activity Monitor counts each core as 100%. Our M1 Pro has 8 cores (6 performance, 2 efficiency), so its ceiling is 800%. We tested it: we started two copies of a do-nothing loop in Terminal, and Activity Monitor showed each at about 94% while the total stayed well under half the chip.
yes > /dev/null & yes > /dev/null & sleep 6; ps -o pid,pcpu,comm -p $(pgrep -d, yes)
PID %CPU COMM
19705 93.4 yes
19706 94.5 yeskillall yes straight after.To view current processor activity, choose Window > CPU Usage. To view recent processor activity, choose Window > CPU History.
The bottom panel works differently: System, User and Idle add up to 100% of the whole chip. So a single app at 120% on an 8-core Mac shows as roughly 15% in the User figure.
What is normal CPU usage on a Mac?
A rough guide, since every Mac and workload differs:
| Situation | Typical total (User + System) | Typical top process | Should you act? |
|---|---|---|---|
| Idle, a few apps open | 2% to 15% | Under 10% | No |
| Browsing, email, documents | 10% to 30% | 10% to 60% in short bursts | No |
| Video call, screen sharing | 20% to 50% | 50% to 150% | No, during the call |
| Export, compile, game | 50% to 100% | Several hundred % | No, it is working |
| Nothing running, but fans loud | Over 30% for 10+ minutes | One app or helper above 100% | Yes |
For reference, our test Mac sat at 42.25% total (16.15 System + 26.10 User) in the screenshot above, with a browser, a VPN, two terminal apps and several developer tools running. Busy, but nowhere near the limit: 57.75% of the chip was still idle.
Why is my Mac CPU usage so high?
High CPU on a Mac almost always comes from one of six sources, and Activity Monitor tells you which within a minute:
- A browser tab. Look for
Helper (Renderer)orWebContentnear the top. Closing the tab ends it. kernel_taskis high. macOS uses it to hold back the CPU when the Mac is hot. The fix is cooling: unblock the vents, get it off a soft surface, close heavy apps. Do not quit it.WindowServeris high. Many windows, external displays or animations. Closing windows and reducing transparency (Accessibility > Display) helps.mds_storesormdworker. Spotlight indexing, usually after an update or a big file copy. It finishes by itself.- Photos, iCloud or backup daemons.
photolibrarydreached 43.6% on our Mac with Photos closed and settled to 0.0% on its own. - An app stuck in a loop. It stays at 100% or more even when you are not using it. Quit it; if it returns, update or reinstall it.
Is my Mac slowing down because it is hot?
Terminal can tell you directly. pmset -g therm reports whether macOS has recorded a thermal or performance warning, meaning it has started holding the CPU back to cool down:
pmset -g therm
Note: No thermal warning level has been recorded
Note: No performance warning level has been recorded
Note: No CPU power status has been recordedIn Activity Monitor, the same thing shows up as kernel_task climbing while the Mac feels hot. The cure is airflow, not quitting processes.
How to check CPU usage on Mac in Terminal
In Terminal, top -o cpu shows CPU usage per process, live, and ps gives a one-off sorted list.
top -l 1 -o cpu -n 5 -stats pid,command,cpu
PID COMMAND %CPU
198 WindowServer 27.2
0 kernel_task 14.0
7816 SafeToQuit 9.7-l 1 for a live view; press q to quit.ps -Aco pid,pcpu,comm -r | head -6
PID %CPU COMM
198 45.7 WindowServer
7816 25.2 SafeToQuit
29139 21.7 managedappdistributiond
29130 20.2 proactiveeventtrackerd-r flag sorts by CPU; see the SS64 ps reference.The first line of top also prints overall load, for example CPU usage: 29.66% user, 13.38% sys, 56.95% idle on our Mac, the same split as Activity Monitor’s panel. More on the history of top and its macOS options.
Can I see CPU usage in the menu bar or Dock?
macOS has no built-in menu bar CPU meter, but Activity Monitor can turn its Dock icon into one: choose View > Dock Icon > Show CPU Usage (a live bar) or Show CPU History (a scrolling graph). For a floating window, choose Window > CPU History (⌘ Command + 3) and tick Keep CPU Windows on Top. If you want it in the menu bar, third-party monitors such as the free, open-source Stats or iStat Menus add one.
How do I check my Mac’s CPU model and cores?
Choose Apple menu > About This Mac: Chip shows the Apple silicon model, Processor the Intel one. For core counts, use Terminal:
sysctl -n machdep.cpu.brand_string hw.ncpu
Apple M1 Pro
8How do I test my Mac’s CPU?
For a hardware check, use Apple Diagnostics: on Apple silicon, shut down, hold the power button until Options appears, then press ⌘ Command + D; on Intel, hold D at startup (Apple’s instructions). It reports a reference code if something is wrong. For performance, a free benchmark such as Geekbench or Cinebench compares your score with other Macs of the same model. A quick stress test is the loop we used above: one yes > /dev/null & per core, then killall yes to stop it.
Watch it done
Frequently asked questions
How can I monitor my CPU usage on a Mac?
Open Activity Monitor and click CPU, or choose Window, CPU History for a floating graph. View, Dock Icon, Show CPU Usage turns the Dock icon into a live meter.
Why is my Mac CPU usage so high?
Usually a browser tab, Spotlight indexing, a sync or backup job, or an app stuck in a loop. If kernel_task is high, the Mac is hot and macOS is slowing the CPU to cool it.
What is a normal CPU usage for a Mac?
Around 2% to 15% total when idle, 10% to 30% for everyday work. Heavy tasks like exports can use all of it. Worry only when usage stays high with nothing running.
Why does Activity Monitor show more than 100% CPU?
% CPU is per core. On an 8-core Mac the maximum is 800%, so 150% means about one and a half cores.
How do I check CPU details on Mac?
Apple menu, About This Mac shows the chip or processor. In Terminal, sysctl -n machdep.cpu.brand_string hw.ncpu shows the model and core count.
How do I run a CPU test on a Mac?
Use Apple Diagnostics for hardware faults, or a benchmark such as Geekbench or Cinebench to compare performance. Avoid long stress tests on a hot laptop.
Should I quit kernel_task if it uses a lot of CPU?
No. kernel_task is the core of macOS; high usage usually means it is keeping the Mac cool. Reduce the heat instead.
Junaid is a software engineer who builds native macOS apps, which means he spends his days inside Activity Monitor, Instruments and the Terminal watching how Mac apps use CPU and memory. Before that he worked as an L2 technical support consultant, resolving around 500 escalated customer tickets with a satisfaction score above 95%. He holds a BSc in Software Engineering from NUST. Every step on this site is re-run on a real Mac before it is published.