How to Check Memory (RAM) Usage on Mac
To check memory usage on a Mac you only need Activity Monitor, but reading it correctly is where most people go wrong: a Mac that looks 85% full can be perfectly healthy. This guide shows how to check RAM usage on Mac, what each number means using real figures from our 16 GB MacBook Pro, and when you actually need more memory.

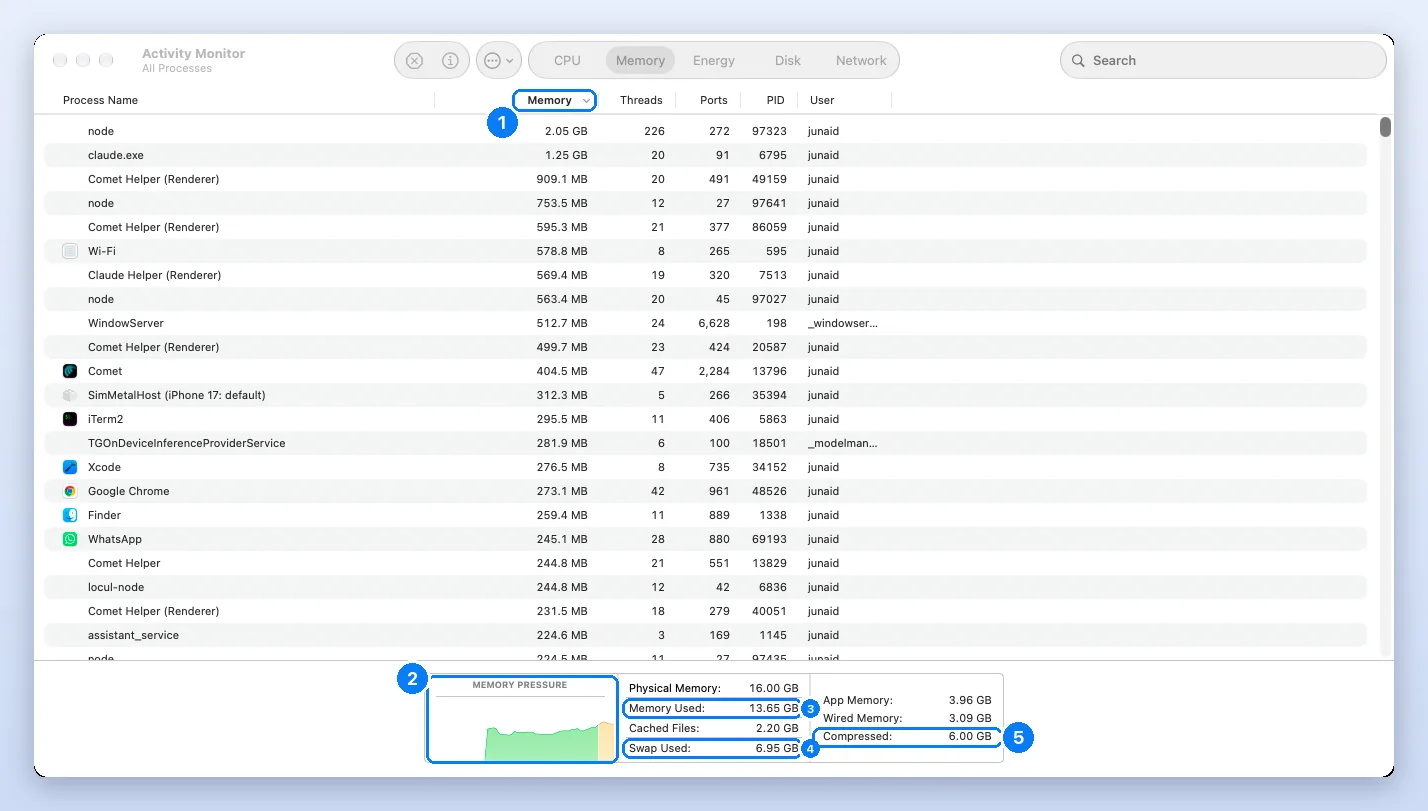
To check memory usage on a Mac, open Activity Monitor (⌘ Command + Space, type Activity Monitor, Return) and click the Memory tab. The bottom panel shows total RAM, Memory Used, Swap Used and the Memory Pressure graph. Judge by the graph, not the used number: green means you have enough RAM, yellow means the Mac is working hard to cope, red means it needs more.
How to check RAM usage on Mac with Activity Monitor
- Open Activity Monitor. Press Command + Space, type Activity Monitor, press Return.
- Click the Memory tab at the top of the window.
- Read the Memory Pressure graph at the bottom left. Green is healthy.
- Sort by the Memory column to see which apps use the most RAM.
- Quit the heaviest app you do not need with the stop button, then watch the graph.
How much RAM does my Mac have?
Choose Apple menu > About This Mac. The Memory line shows the installed RAM, for example 16 GB on our test MacBook Pro. Activity Monitor shows the same figure as Physical Memory. In Terminal:
sysctl -n hw.memsize
17179869184What do the memory numbers mean?
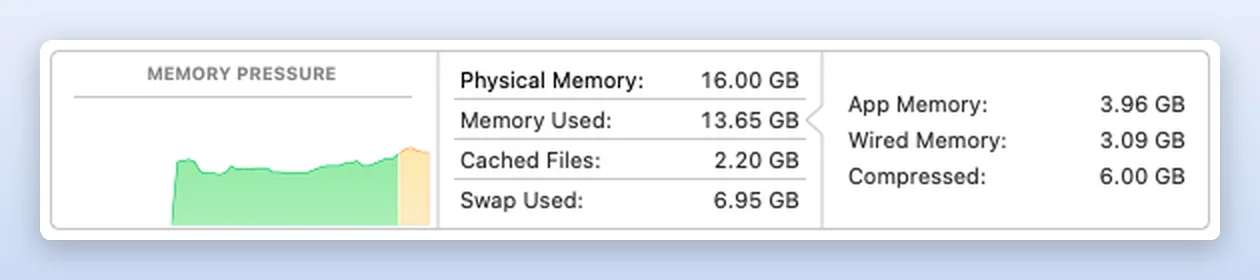
Memory Used tells you how much RAM is in use, but on a Mac the numbers that matter are Memory Pressure and Swap Used. Here is every figure in that panel, with our test Mac’s real reading and what it tells you:
| Field | Our Mac | What it means |
|---|---|---|
| Physical Memory | 16.00 GB | RAM installed. On Apple silicon it cannot be upgraded later |
| Memory Used | 13.65 GB | Total RAM in use by apps and macOS. Looks high on most Macs, by design |
| App Memory | 3.96 GB | Memory your apps and their helpers are using right now |
| Wired Memory | 3.09 GB | Reserved by macOS itself; cannot be freed |
| Compressed | 6.00 GB | Inactive memory squeezed to make room, instead of writing it to disk |
| Cached Files | 2.20 GB | Recently used files kept in spare RAM. Freed instantly when an app needs it |
| Swap Used | 6.95 GB | Memory moved out to the SSD. Some is fine; a large, growing number is not |
Compressed: The amount of memory that has been compressed to make more RAM available. When your computer approaches its maximum memory capacity, inactive apps in memory are compressed, making more memory available to active apps.
Compression is the reason a Mac can run well with “full” memory. Squeezing inactive memory is much faster than writing it to disk, which is the idea behind virtual memory compression. On our Mac, 6.00 GB of compressed memory was holding what would otherwise have needed far more RAM.
What does memory pressure mean?
Memory pressure is macOS’s own verdict on whether your RAM is enough: green means yes, yellow means barely, red means no.
Green memory pressure: Your computer is using all of its RAM efficiently. Yellow memory pressure: Your computer might eventually need more RAM. Red memory pressure: Your computer needs more RAM.
Apple builds the graph from free memory, swap rate, wired memory and file cache. In practice: if the graph is green most of the day, you have enough RAM for how you use your Mac, whatever the used figure says. If it turns yellow whenever you open your usual set of apps, you are at the limit. If it goes red, the Mac is swapping hard and will feel slow.
How do I see which app uses the most memory?
In the Memory tab, click the Memory column header so the largest is first. Two things surprise people:
- Browsers split into many processes. Each Chrome, Edge or Comet tab is its own Helper (Renderer) process, and so are the windows of many desktop apps built on web technology. Four of our top 10 were Helper (Renderer) processes. Add them up to see an app’s real total.
- Developer tools are heavy.
nodealone used 2.05 GB on our Mac. Xcode, Docker and iPhone simulators are similar.
For a per-app total, choose View > All Processes, Hierarchically. Child processes sit under the app that launched them.
How to check memory usage on Mac in Terminal
Three built-in commands cover it. All outputs below are real, from our test Mac.
memory_pressure | tail -1
System-wide memory free percentage: 50%top -l 1 -o mem -n 5 -stats pid,command,mem
PID COMMAND MEM
6795 claude.exe 1298M
98565 node 1029M
49159 Comet Helper (Re 835M
86059 Comet Helper (Re 645M
595 WiFiAgent 579Msysctl vm.swapusage
vm.swapusage: total = 8192.00M used = 6661.94M free = 1530.06M (encrypted)vm_stat gives raw page counts if you want more detail; multiply pages by 16,384 bytes on Apple silicon (the page size it prints in its first line). See the SS64 top reference for every option.
How do I free up RAM on my Mac?
- Quit apps you are not using with ⌘ Command + Q. Closing the window is not enough.
- Close browser tabs, especially video, maps and web apps. Each is a separate process.
- Restart if the Mac has been on for days. It clears swap and any app that has been slowly growing. Our test Mac had 4 days of uptime and 6.66 GB of swap.
- Check login items in System Settings > General > Login Items & Extensions (Login Items on macOS 14 and earlier) and remove what you do not need at startup.
- Look for jetsam reports. When memory runs out completely, macOS ends processes and writes a
JetsamEventreport, which you can find in the Console app, or in the folder /Library/Logs/DiagnosticReports. Our test Mac had one from 29 September. Apple explains them in its developer documentation. - Skip “RAM cleaner” apps. They force macOS to throw away cache that it would have reused, so apps reload more slowly afterwards.
How much RAM does a Mac need: 8, 16, 24 or 32 GB?
Because Apple silicon memory is fixed at purchase, it is worth getting right. Use your own Memory Pressure graph as the judge: a week of green means your current amount fits your work. As a starting point:
| RAM | Comfortable for | Pressure turns yellow when |
|---|---|---|
| 8 GB | Web, email, documents, streaming | Many browser tabs plus a video call |
| 16 GB | All of the above plus photo editing, light coding, many tabs | Local servers, Docker or big Xcode builds (what we saw on our test Mac) |
| 24 GB | 4K video editing, larger code projects, several heavy apps | Multiple virtual machines |
| 32 GB+ | Virtual machines, large datasets, local AI models, 8K video | Rarely, for most people |
If your pressure is often yellow or red and you cannot upgrade, the fixes above plus a weekly restart go a long way. To confirm whether your Mac has upgradeable memory, hold ⌥ Option, choose Apple menu > System Information and click Memory.
Watch it explained
Frequently asked questions
How do I check my RAM usage on a Mac?
Open Activity Monitor and click the Memory tab. Memory Used and the Memory Pressure graph are at the bottom; sort the Memory column to see which apps use the most.
Is it bad if my Mac memory is almost full?
Not by itself. macOS fills spare RAM with cache on purpose. It only matters if the Memory Pressure graph is yellow or red, or Swap Used keeps growing.
How can I monitor my Mac's RAM usage all the time?
In Activity Monitor, choose View, Dock Icon, and pick a graph, or use a menu bar monitor app. In Terminal, memory_pressure gives a one-line health check.
How do I free up RAM on my Mac?
Quit apps you are not using with Command + Q, close heavy browser tabs, and restart if the Mac has been on for days. Avoid RAM cleaner apps.
Is 16 GB of RAM enough for a Mac?
For most people, yes, including photo editing and light development. If your Memory Pressure graph stays green through your normal day, it is enough for you.
Do I need 16 GB or 24 GB?
Choose 24 GB if you edit 4K video, run large code projects or several heavy apps at once. For browsing, office work and photos, 16 GB is plenty.
Do I really need 32 GB or is 16 GB enough?
32 GB is for virtual machines, local AI models, large datasets or 8K video. Most people see green memory pressure on 16 GB.
What is swap used on Mac?
Memory macOS has moved from RAM onto the SSD to make room. A few GB is normal; a large number that grows every day means you regularly run short of RAM.
Junaid is a software engineer who builds native macOS apps, which means he spends his days inside Activity Monitor, Instruments and the Terminal watching how Mac apps use CPU and memory. Before that he worked as an L2 technical support consultant, resolving around 500 escalated customer tickets with a satisfaction score above 95%. He holds a BSc in Software Engineering from NUST. Every step on this site is re-run on a real Mac before it is published.